------------------------------ Tab1 showing ------------------------------
Basic Information
Features
- [Present] Digital Signage
- [Share & Analyze] Compilation, Analysis and Sharing of Data
- [Monitor] Demand Monitoring
- [Organize] Document Form
See "Data" page for free of charge EnerVisualizeR graphic data.
You can download the data for free from our website.
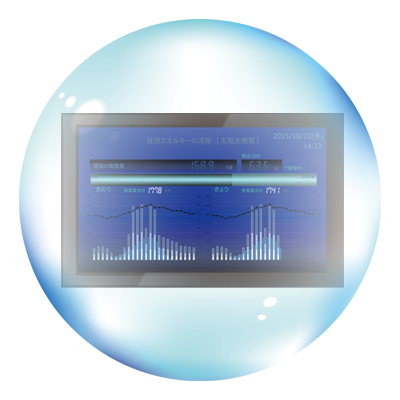
The digital signage function of EnerVisualizeR promotes active participation of employees in energy-saving activities.
It can also be used to show energy-saving activities conducted at the facility to visiting customers.
Factory

Show production progress and efficiency

Show energy consumption of whole factory in realtime.


Show energy saving activity as a part of education
Show real-time renewable energy usage
 Demonstrates your efforts on energy saving to your visitors.

Show power usage
![]() Share your efforts on energy saving among all workers
Share your efforts on energy saving among all workers


![[共有・分析する] 集計・分析・Web共有](https://ap.industry.panasonic.com/hubfs/pid-corp/products/fasys/eco/software/enervisualizer/images/pic201.jpg) Predictive monitoring is conducted every minute to check the possibility of the demand exceeding the set value. If the demand is about to exceed the set level, a 3-stage alarm is generated.
Predictive monitoring is conducted every minute to check the possibility of the demand exceeding the set value. If the demand is about to exceed the set level, a 3-stage alarm is generated.
Information of the demand can be displayed on the digital signage. Past records, graphs and numerical data can be output as a hard copy for easy confirmation.
![[監視する] デマンド監視](https://ap.industry.panasonic.com/hubfs/pid-corp/products/fasys/eco/software/enervisualizer/images/pic301.jpg)
Daily / weekly / monthly report can be automatically produced based on the data accumulated and Compiled By EnerVisualizeR. Since the document is output as a Microsoft® Excel® file, the user can change the layout easily.
* Documents are prepared based on the data collected by EnerVisualizeR. Regarding the data collection period and frequency, refer to the EnerVisualizeR User's Manual.

![[情報をまとめる] 帳票を出力する](https://ap.industry.panasonic.com/hubfs/pid-corp/products/fasys/eco/software/enervisualizer/images/pic401.jpg)
Daily / weekly / monthly report can be automatically produced based on the data accumulated and Compiled By EnerVisualizeR. Since the document is output as a Microsoft® Excel® file, the user can change the layout easily.
* Documents are prepared based on the data collected by EnerVisualizeR. Regarding the data collection period and frequency, refer to the EnerVisualizeR User's Manual.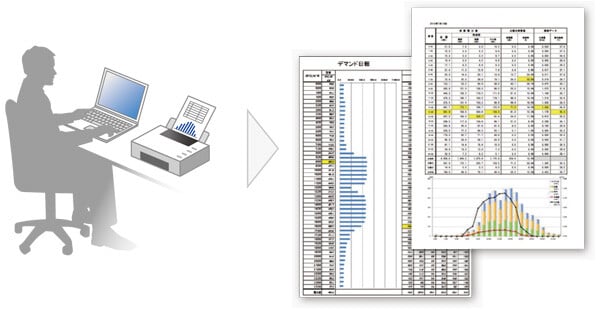
------------------------------ Tab2 showing ------------------------------
System Configuration
EnerVisualizeR & Energy Consumption Visualization Components System configuration

![]()
Max. number of registrations
| Item | Max.number of registrations | |
|---|---|---|
| FP7/FP0H/DLL/ELC□ | 100*1 | |
| Logging device | 2,000*2, 10,000*3 | |
| Inst. device | 2,000*4, 10,000*3 | |
| Device alarm | 100*4 | |
| Cycle execution script | 10*4 | |
| Digital signage screen | 100, 1,000*3 | |
| Analysis view | Personal view | each user:100 |
| Published view | all users total:100 | |
| Report | Report | 30 |
| Device | 200 | |
| User | 100 | |
| Alarm-mail recipient | 100*4 | |
------------------------------ Tab3 showing ------------------------------
------------------------------ Tab4 showing ------------------------------
------------------------------ Tab5 showing ------------------------------
Dedicated software
EnerVisualizeR Software Screens and Setting Examples
Configurator EVR
Software for entering EnerVisualizeR server settings (registration of data read from FP7 / DLL / ELC□)
Registration of points
[Demand alarm monitor]
This screen is used to enter settings for the demand alarm function.
Up to 30 demand monitoring points can be set.
[Data group]
This screen is used to select the method of compiling data for the display of graphs.
[Logging device registration]
This screen is used to register devices for the plotting of graphs.
Up to 10,000 points (5 times more than that of the previous system)(Note) can be registered.
(Note) Ver. 1.31 or newer
Registration of units
By entering Java Scripts, values obtained from units can be converted to an easy-to-understand measurement unit at a certain interval for display / storage.
System Manager
Software for the management of EnerVisualizeR server
Main screen

Web UI
Web service for visualizing the results of analysis of obtained data, for displaying produced digital signage screens and for conducting operational maintenance.
Digital signage setup

------------------------------ Tab6 showing ------------------------------
Data
EnerVisualizeR Graphic Data Library
Graphic data to help creating monitoring screen, "EnerVisualizeR Graphic Data Library " can be downloaded for free .
>>Registration for Panasonic Automation Controls Web Members is required for download
>>Download
Graphic data examples
icon
animation


background
sound

click icon to listen
* Sound above is MP3 format.
There is a possibility you cannot play the sound depends on your environment such as version of PC, OS or browser.